
Research
Unraveling Tectonic Signals: Distinguishing Dynamic subsidence from Flexural Subsidence
Introduction
Dynamic topography is the vertical movement of Earth's surface caused by mantle flow.
When this movement results in the surface lowering, it's called dynamic subsidence.
Such process typically has a long wavelength of approximately 500 to 2,000 km.
In contrast, flexural subsidence results from the bending of the Earth's crust due to surface loading, such as mountain building.
It commonly occurs in front of mountain belts (with a shorter wavelength of <~200-300 km), forming a series of foreland basins.
Although flexural subsidnece has long been considered the dominant mechanism of the formation of the Late Cretaceous (~100-66 Ma) Cordilleran foreland basin (CFB), dynamic topography has increasingly been invoked as another mechanism to explain the subsidence and migration of depocenters during the Late Cretaceous.
However, it remains a challenging task to distinguish the effects of dynamic subsidence from those of other subsidence mechanisms, such as flexural loading.
To address this, we studied the relationship between accommodation space and subsidence patterns of the Late Cretaceous CFB across time and space. Seventy-six well logs from two Laramide foreland basins, the Piceance and Denver basins, were used to develop a high-resolution sequence stratigraphic framework.
Methodology
1. Compilation of stratigraphic nomenclature and correlation of Cenomanian to Maastrichtian rock units with biostratigraphic and geochronologic age constraints across the Cordilleran Foreland basin.
2. Outcrop to subsurface sequence-stratigraphic correlations across the study area based on regional flooding surfaces and chronostratigraphic surfaces constrained by ammonite biozones
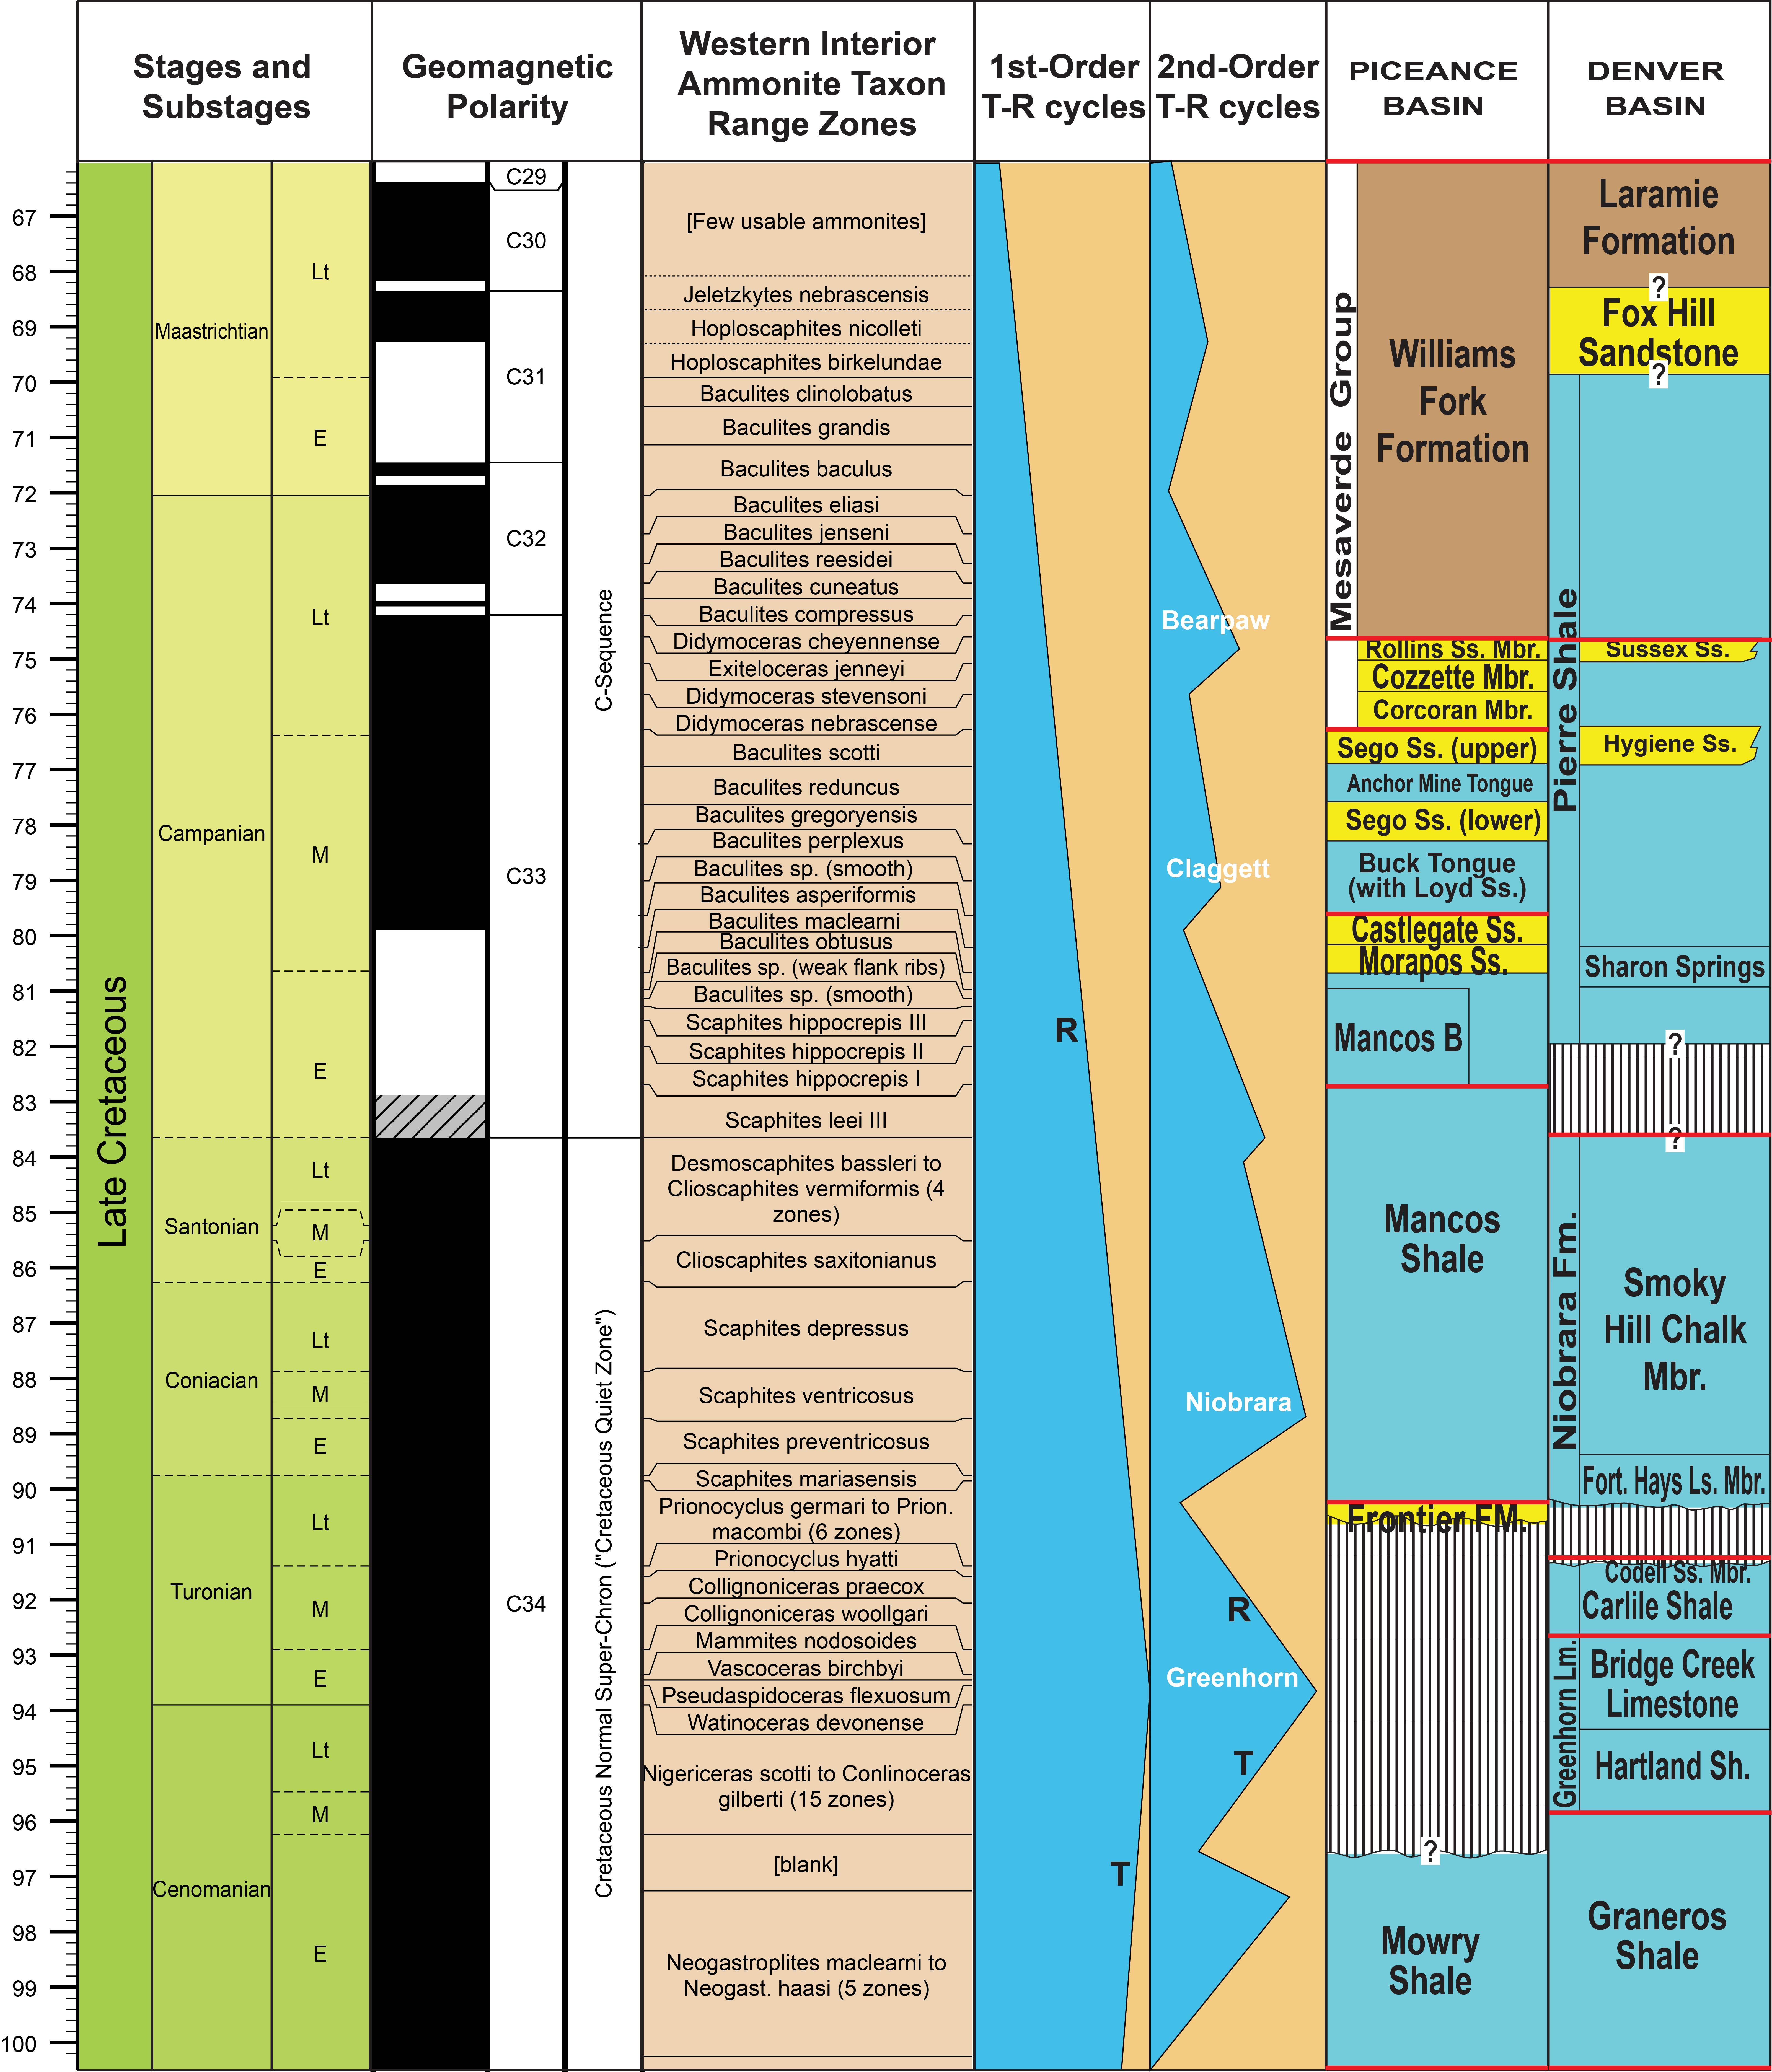
Figure 1. Chronostratigraphic framework of upper Cretaceous strata in the study area.
3. Development of regional isopach maps to depict depocenter migration spatially and temporally in ArcGIS Pro, based on six successive time intervals from the Cenomanian to Maastrichtian stages, identified from seventy-six well logs using both Gamma-Ray and Resistivity. logs in IHS Petra.
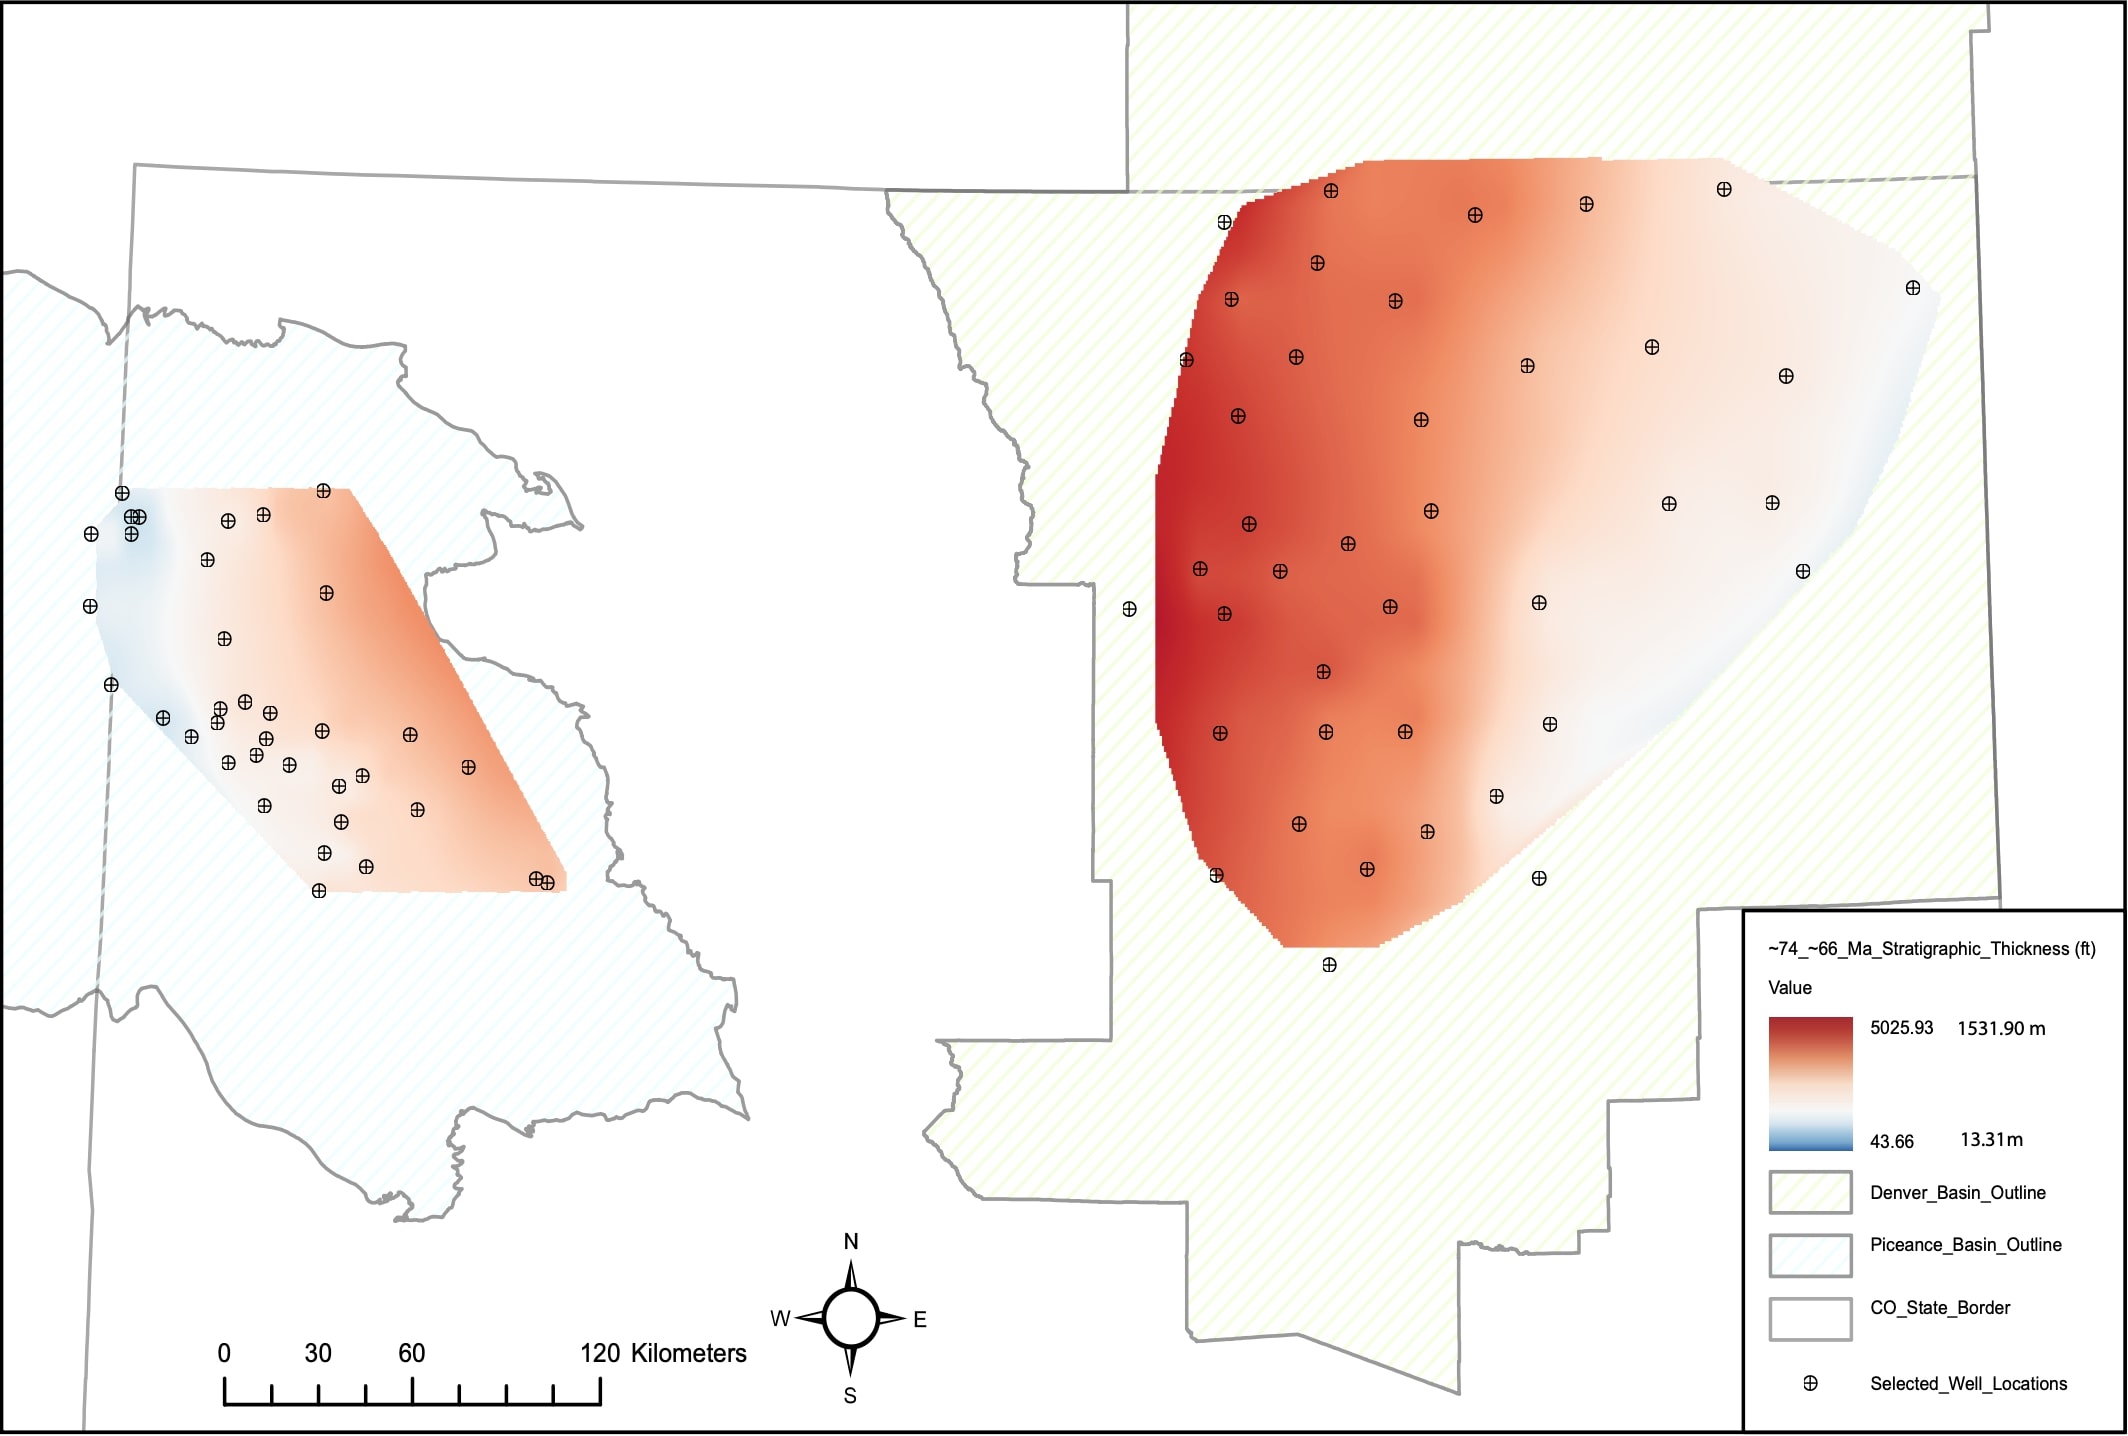
Figure 2. An isopach map (~76-66 Ma) that shows eastward thickening in the Piceance Basin and westward thickening in Denver Basin, with high overall sedment accumulation rate of up to 133.2 and 192.4 m/Ma, respectively.
4. 1D backstripping on 4 wells (2 per basin) to correct for sediment loading effects

Figure 3. Tectonic subsidence curves in the Piceance and Denver basins developed through 1D backstripping using two wells from each basin.
Insights
1. Loading of the Sevier thrust belt caused dominant flexural subsidence in both basins from ~100–90 Ma.
2. Piceance Basin experienced early dynamic subsidence from ~90–83 Ma, with high sedimentation and tectonic subsidence rates.
3. Dynamic subsidence shifted to the Denver Basin from ~83–72 Ma, showing similar rates to the earlier Piceance phase.
4. Laramide Orogeny (~72 Ma) added flexural subsidence in Denver; dynamic subsidence continued in both basins but declined.
5. Piceance’s later subsidence (~72–66 Ma) remained mostly dynamic, as adjacent Laramide uplifts formed later.
Small foreland basins allow high-resolution timeline picking because of similar geologic formations. More time picks of detailed foreland basins integrated with backstripping techniques could improve our ability to distinguish different tectonic subsidence patterns.
Research Output